Central Limit Theorem and Law of Large Numbers
This applet illustrates how the distribution of the sample mean converges towards normality as sample size increases.
1. Taking a sample element-by-element
Initially we see a sample of size 1 (a single element) drawn from a uniform distribution U(0,1), shown as a cross on the vertical axis, and its sample mean (shown as a green triangle). Drag the dashed line to increase the sample element-by-element. The history of the sample mean $\overline{x}$ is traced by the green line. What is happening to $\overline{x}$ as the sample size increases?
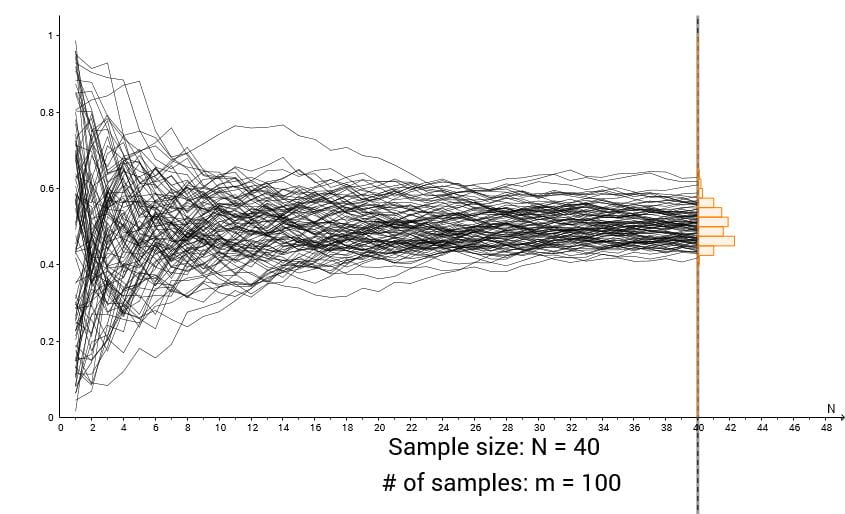
2. Taking many samples
Click ‘Increase # of samples’ to repeat the experiment. You will see a new path for the sample mean, alongside the original. Now that we have two samples, we can start to build up a histogram of the sample means – shown in green along the dashed line. Click ‘Increase # of samples’ repeatedly (or use the slider) to take more and more samples. What is happening to the shape of the histogram? What is happening to the ‘tangle’ of sample mean paths? Try dragging the sample size line to investigate different sample sizes.
Other resources: