Logistic population growth
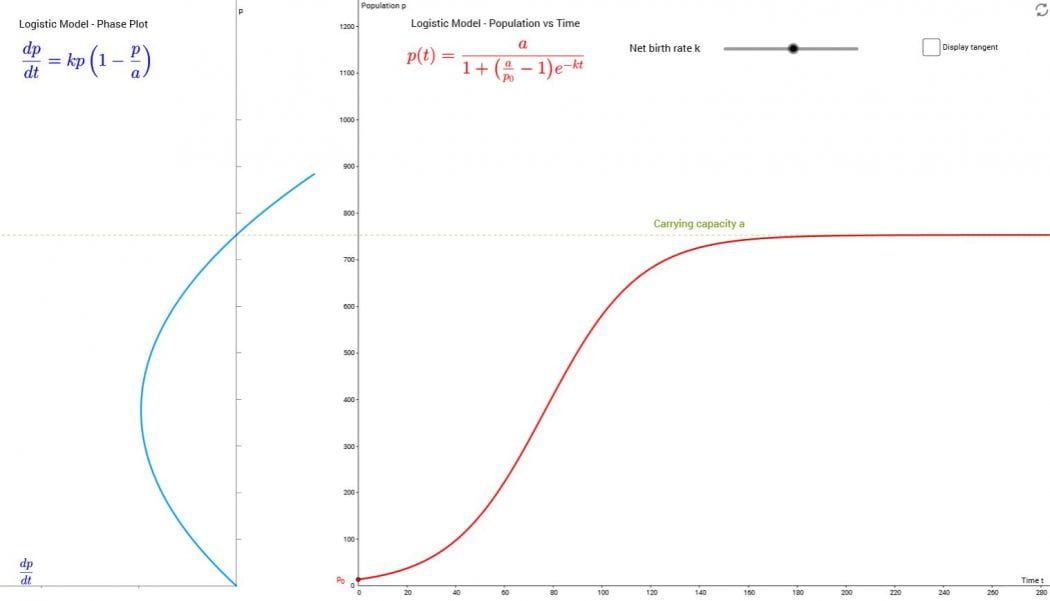
This applet explores a logistic population growth model with no harvesting. The phase plot is shown alongside the plot of p vs t.
The carrying capacity a can be changed by dragging the capacity line.
The initial population p0 can be changed by dragging the point, and can start above the carrying capacity.
The slider controls the net birth rate k.
The phase plot has been plotted sideways on the same population axis as the population vs time plot, as the differential equation specifies the population growth rate as a function of the population.
You can show the tangent line to the population vs time graph and the relationship back to the phase plot by clicking on the ‘Display tangent’ box.
Other resources: