Maximum likelihood estimators
This applet shows the (log of the) likelihood function, and the maximum likelihood estimator, for a sample and various statistical models.
This applet demonstrates the principle of maximum likelihood estimation.
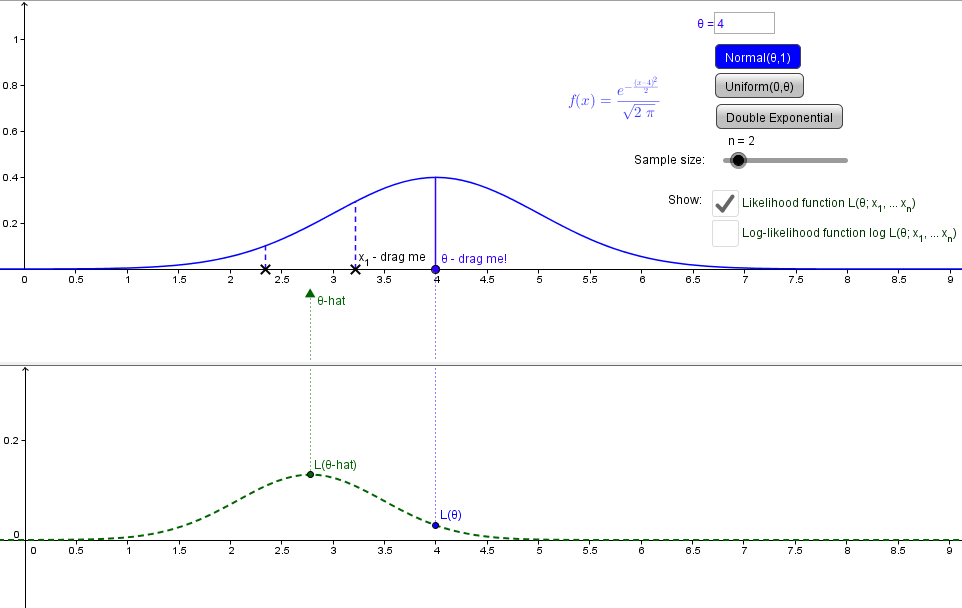
The blue curve represents a possible population generating the data, with parameter θ. You can change population types by using the buttons at top-right.
An actual observed sample x1, x2, … is shown along the horizontal axis. You can adjust the sample size n using the slider at the top-left. You can move individual sample observations by dragging them. The likelihood of each xi for the current θ value is shown as a dotted blue line.
You can drag the blue point to adjust θ, and observe how the likelihoods of the sample points are affected. You can also key in a new value for θ in the text box. Try to guess the MLE by dragging θ and observing the likelihoods, particularly for sample sizes 1 and 2.
You can show the likelihood of the whole sample, and the MLE, using the 'Likelihood function' checkbox. You can switch to the log-likelihood of the whole sample using the 'Log-likelihood' checkbox.
You can also use the zoom buttons and arrows to adjust the views of the windows.
Other resources: