Visualising the span of two vectors
This applet visualises the span of two vectors in ℝ3 using linear combinations.
A linear combination of two vectors u, v is a vector of the form α1u + α2v, where α1, α2 ∈ ℝ are constants.
The span of two vectors, span{u,v}, is the set of all possible linear combinations of the vectors.
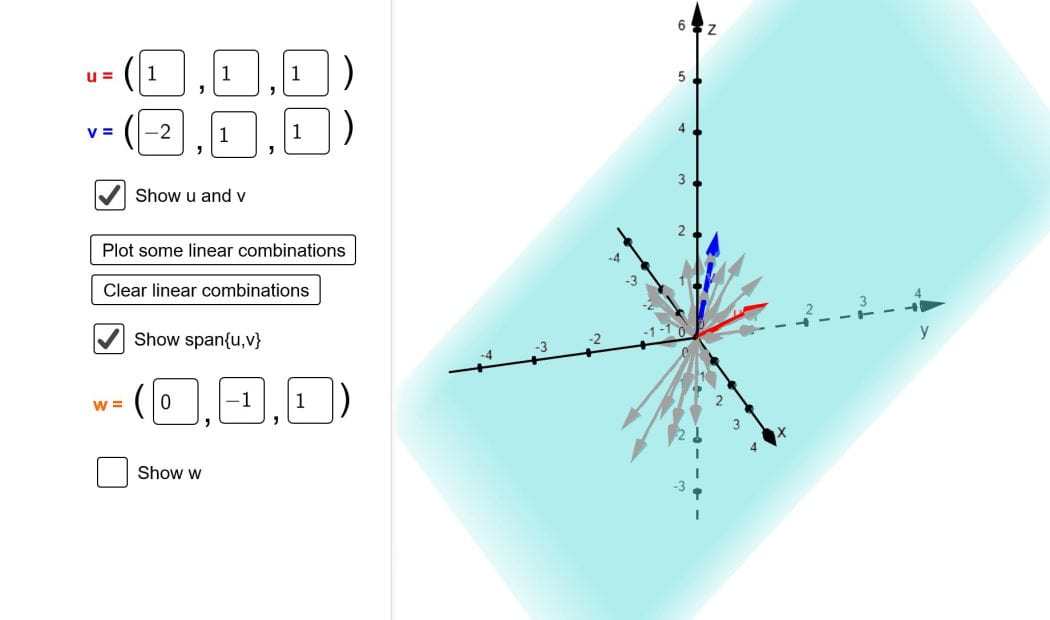
This applet shows two vectors u and v in ℝ3. Click “Plot some linear combinations” to generate some random linear combinations of the two vectors. Click and drag the plot to change the view. What do you notice about all the vectors? Can you guess what span{u, v} is, geometrically?
Click “show span{u, v}” to show the entire span.
You can add a third vector w to the plot. Try setting w to u+v. Is it in span{u, v}? Does this make sense?
Now set w to some other vector. Is w in span{u, v}? What does it mean if it isn’t?
Other resources: