Category: Applets
-
Confidence Intervals for the Weibull distribution
Comparing the lengths of non-symetric CI’s with that of the symmetric CI of the same level of confidence. Select the level of confidence $(1-a)*100$ by chosing the value of $a$. Select the value of the shape parameter $k$ of the Weibull distribution. The symmetric CI has equal probability of the left and right tails. By […]melbapplets.ms.unimelb.edu.au/2024/10/15/confidence-intervals-for-the-weibull-distribution
-
Confidence Intervals of Minimal Length for the F Distribution
We minimise the lengths of confidence intervals of a given level of confidence by varying the tail probabilities ratio. Select the level of confidence $(1-a)*100$ by chosing the value of $a$. Select the two values of the degrees of freedom, $n$ for the numerator and $m$ for the denominator of the F-distribution. The symmetric CI […] -
Bivariate normal and regression lines
Visualise how the regression lines E(Y|X) and E(X|Y) change when the values of the parameters of the given bivariate normal change.melbapplets.ms.unimelb.edu.au/2024/10/09/bivariate-normal-and-regression-lines
-
Bases and Coordinates in R2
This applet demonstrates the concept of co-ordinate vectors in R^2.melbapplets.ms.unimelb.edu.au/2024/04/05/bases-and-coordinates-in-r2
-
Visualising the Gram-Schmidt Algorithm
This applet demonstrates the Gram-Schmidt algorithm performed in R^3.melbapplets.ms.unimelb.edu.au/2024/04/05/visualising-the-gram-schmidt-algorithm
-
Visualising linear transformations in R2
This applet shows the geometric effect of a linear transformation T: R^2 → R^2.melbapplets.ms.unimelb.edu.au/2024/03/25/visualising-linear-transformations-in-r2
-
Visualising linear transformations in R3
This applet shows the geometric effect of a linear transformation T in R^3.melbapplets.ms.unimelb.edu.au/2024/03/25/visualising-linear-transformations-in-r3
-
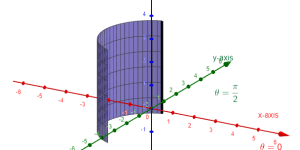
Cylindrical Coordinates Visual (Engineering Maths)
This applet helps visualise the surface generated by cylindrical coordinates using r,θ and z. Click and drag on the sliders on the left to adjust the ranges for r,θ and z. Geogebratube page for this appletmelbapplets.ms.unimelb.edu.au/2024/02/28/cylindrical-coordinates-engineering-maths
-
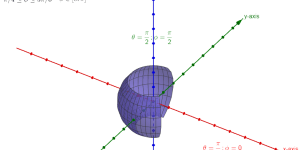
Spherical Coordinates Visual (Engineering Maths)
This applet visualises surfaces generated by spherical coordinates using r,θ and φ. Click and drag on the sliders on the left to change the values for r,θ and φ. Click and drag on the graph to change/rotate the view. Geogebratube page for this appletmelbapplets.ms.unimelb.edu.au/2024/02/28/spherical-coordinates-visual-engineering-maths
-
Solution of the heat equation
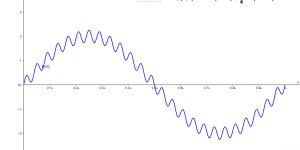
This applet shows a solution of the heat equation, a partial differential equation from MAST20029 Engineering Mathematics.melbapplets.ms.unimelb.edu.au/2023/05/26/solution-of-the-heat-equation
Number of posts found: 57


