Confidence intervals, hypothesis testing and p-values
This illustrates the connection between a confidence interval, a formal hypothesis test, and the p-value of a hypothesis test.
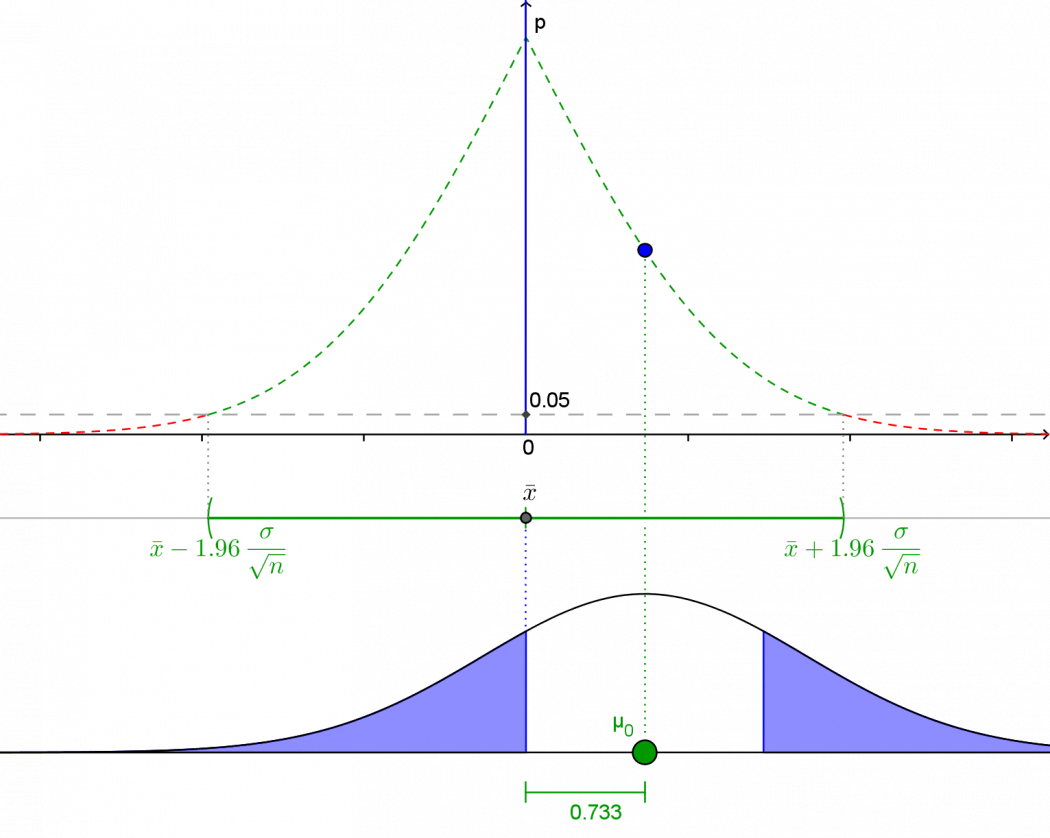
- The confidence interval. The green line shows the 95% confidence interval for μ, based on a sample mean $\overline{x}$ and standard error $\displaystyle \frac{\sigma}{\sqrt{n}}$.
Drag the green point to see what happens as $\mu_0$ changes. -
The null distribution. Click Show null distribution to show the distribution of $\overline{X}$ under the null hypothesis $H_0: \mu = \mu_0$.
The shaded areas in the tails represent the p-value for a 2-sided hypothesis test.
Click Show p-value to see its numerical value.
Drag the point $\mu_0$ to see how the p-value changes as the difference $\mu_0 – \overline{x}$ changes. Click the ‘play’ button to make it animate! - The p-curve. Drag the point $\mu_0$ to change the hypothesised value of the population mean $\mu_0$. Observe how the p-value changes as $\mu_0 – \overline{x}$ changes.
You can change the confidence level by typing a value in the box for or dragging the dashed grey line in the top plot. How does this affect the confidence interval? How does it affect the p-curve?
Other resources: