Tag: MAST10010
-
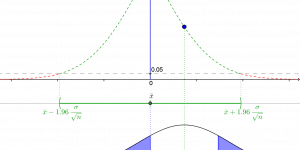
Confidence intervals, hypothesis testing and p-values
This applet illustrates the connection between a confidence interval, a formal hypothesis test, and the p-value of a hypothesis test.melbapplets.ms.unimelb.edu.au/2021/07/12/confidence-intervals-hypothesis-testing-and-p-values
-
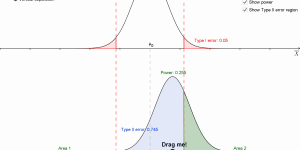
Power of a hypothesis test
This applet gives a visualisation of the concept of statistical power, and helps illustrate the relationship between power, sample size, standard deviation and difference between the means.melbapplets.ms.unimelb.edu.au/2021/07/12/power-of-a-hypothesis-test
-
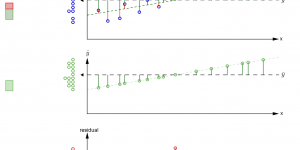
Partitioning of variability in regression
This applet illustrates partitioning of variability into explained (fitted) and unexplained (residual) variability.melbapplets.ms.unimelb.edu.au/2021/07/12/partitioning-of-variability-in-regression
-
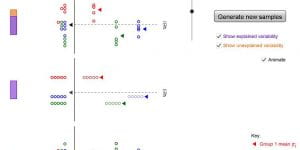
Partitioning of variability in ANOVA
This applet illustrates the partitioning of variability into explained and unexplained variability, in the context of ANOVA.melbapplets.ms.unimelb.edu.au/2021/07/12/partitioning-of-variability-in-anova
-
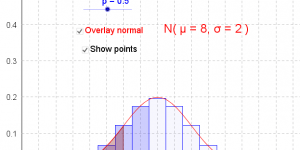
Normal approximation to the binomial distribution
This applet explores the normal approximation to the binomial distribution.melbapplets.ms.unimelb.edu.au/2021/07/09/normal-approximation-to-the-binomial-distribution
-
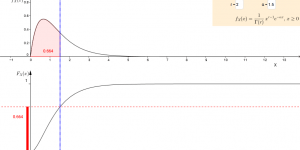
Discrete and continuous distributions
This applet explores the relationship between the pmf or density and the cumulative distribution function of a range of discrete and continuous probability distributions.melbapplets.ms.unimelb.edu.au/2021/07/09/discrete-and-continuous-distributions
-
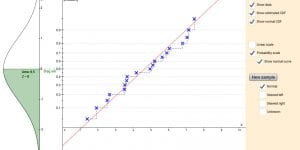
Normal probability plot and CDF
This applet shows the relationship between a plot of an estimated empirical CDF and a normal probability plot.melbapplets.ms.unimelb.edu.au/2021/07/09/normal-probability-plot-and-cdf
-
QQ plots
This applet explores QQ-plots for a range of distributions. -
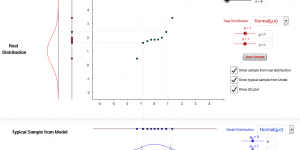
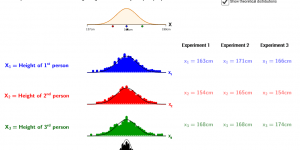
Random variables
This applet illustrates the concept of independent identically distributed random variables. -
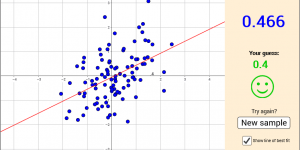
Guess the correlation
Guess the correlation of a sample of bivariate data drawn from a linear or non-linear population.melbapplets.ms.unimelb.edu.au/2021/07/08/guess-the-correlation
Number of posts found: 11