Partitioning of variability in ANOVA
This applet illustrates the partitioning of variability into explained and unexplained variability, in the context of ANOVA.
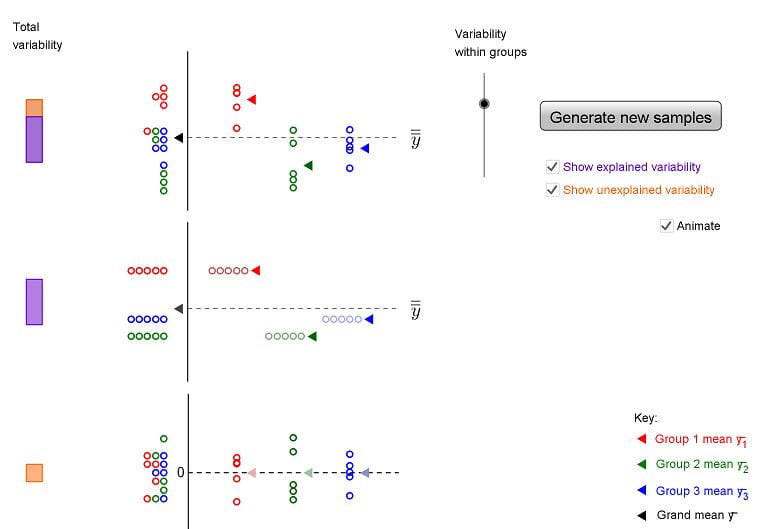
The top plot shows data from three groups (group 1, group 2, group 3). A dotplot of the combined data is shown on the left, and the grand mean $\bar{\bar{y}}$ is shown as the horizontal line.
Click and drag the coloured arrows to change the group means. Adjust the within-groups variability by dragging the slider. Click Generate new samples to produce a new set of data.
Click Show explained variability and Show unexplained variability to visualise the partitioning of variability into explained and unexplained components.
The middle plot shows a separate-means model for the data. This accounts for the explained (between-groups) variability.
The bottom plot shows the unexplained (residual) variability within groups.
The corresponding parts of the overall variability, shown in the bar to the left, are coloured.
Other resources:
Related applet: Partitioning of variability in regression
Publication: Applets to support reasoning about explained and unexplained variability (Anthony Morphett, Sharon Gunn). In Proceedings of OZCOTS 2016