Tag: MAST20005
-
Confidence Intervals for the Weibull distribution
Comparing the lengths of non-symetric CI’s with that of the symmetric CI of the same level of confidence. Select the level of confidence $(1-a)*100$ by chosing the value of $a$. Select the value of the shape parameter $k$ of the Weibull distribution. The symmetric CI has equal probability of the left and right tails. By […]melbapplets.ms.unimelb.edu.au/2024/10/15/confidence-intervals-for-the-weibull-distribution
-
Confidence Intervals of Minimal Length for the F Distribution
We minimise the lengths of confidence intervals of a given level of confidence by varying the tail probabilities ratio. Select the level of confidence $(1-a)*100$ by chosing the value of $a$. Select the two values of the degrees of freedom, $n$ for the numerator and $m$ for the denominator of the F-distribution. The symmetric CI […] -
Bivariate normal and regression lines
Visualise how the regression lines E(Y|X) and E(X|Y) change when the values of the parameters of the given bivariate normal change.melbapplets.ms.unimelb.edu.au/2024/10/09/bivariate-normal-and-regression-lines
-
Confidence intervals, hypothesis testing and p-values
This applet illustrates the connection between a confidence interval, a formal hypothesis test, and the p-value of a hypothesis test.melbapplets.ms.unimelb.edu.au/2021/07/12/confidence-intervals-hypothesis-testing-and-p-values
-
Power of a hypothesis test
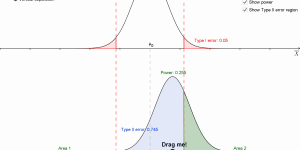
This applet gives a visualisation of the concept of statistical power, and helps illustrate the relationship between power, sample size, standard deviation and difference between the means.melbapplets.ms.unimelb.edu.au/2021/07/12/power-of-a-hypothesis-test
-
Partitioning of variability in regression
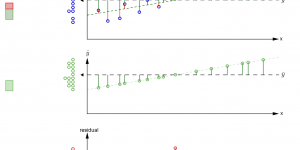
This applet illustrates partitioning of variability into explained (fitted) and unexplained (residual) variability.melbapplets.ms.unimelb.edu.au/2021/07/12/partitioning-of-variability-in-regression
-
Partitioning of variability in ANOVA
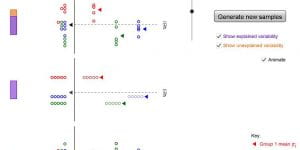
This applet illustrates the partitioning of variability into explained and unexplained variability, in the context of ANOVA.melbapplets.ms.unimelb.edu.au/2021/07/12/partitioning-of-variability-in-anova
-
Distribution of order statistics
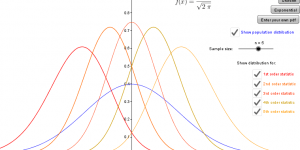
This applet displays the distribution for the order statististics of a sample of size n from an arbitrary population distribution.melbapplets.ms.unimelb.edu.au/2021/07/12/distribution-of-order-statistics
-
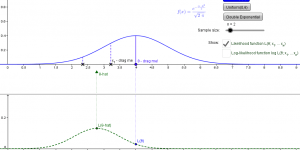
Maximum likelihood estimators
This applet shows the maximum likelihood estimator and (log) likelihood function for several statistical models.melbapplets.ms.unimelb.edu.au/2021/07/12/maximum-likelihood-estimators
-
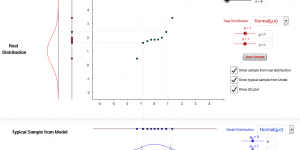
QQ plots
This applet explores QQ-plots for a range of distributions.
Number of posts found: 11


