Category: Applets
-
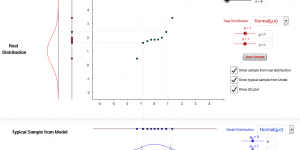
QQ plots
This applet explores QQ-plots for a range of distributions. -
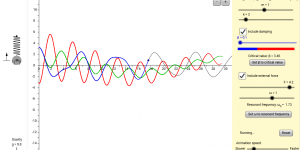
Model of a spring with drag and forcing
This applet simulates a spring acting under gravity, subject to drag and an external driving force.melbapplets.ms.unimelb.edu.au/2021/07/09/model-of-a-spring-with-drag-and-forcing
-
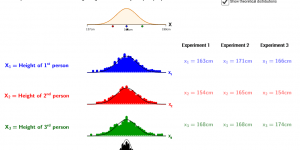
Random variables
This applet illustrates the concept of independent identically distributed random variables. -
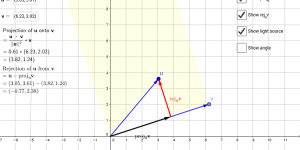
Vector projections
This applet aims to demonstrate visually the projection of a vector u onto a vector v. -
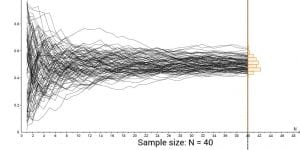
Central Limit Theorem and Law of Large Numbers
This applet illustrates how the distribution of the sample mean converges towards normality as sample size increases.melbapplets.ms.unimelb.edu.au/2021/07/08/central-limit-theorem-and-law-of-large-numbers
-
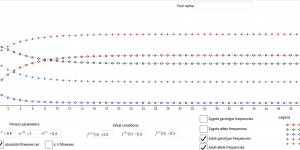
Population genetics by FHW model
This applet calculates the zygote and adult allele and genotype frequencies according to the Fisher-Haldane-Wright model of population genetics, and plots the results.melbapplets.ms.unimelb.edu.au/2021/07/08/population-genetics-by-fhw-model
-
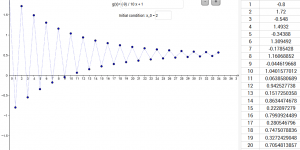
Iterating a difference equation
This applet iterates a difference equation (also known as recurrence relation) and displays the resulting sequence both graphically and numerically.melbapplets.ms.unimelb.edu.au/2021/07/08/iterating-a-difference-equation
-
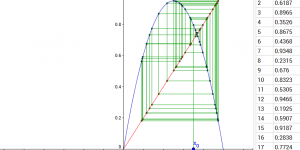
Cobwebbing a difference equation
This worksheet performs iteration and produces cobweb diagrams for a first-order difference equation (AKA recurrence relation, discrete dynamical system).melbapplets.ms.unimelb.edu.au/2021/07/08/cobwebbing-a-difference-equation
-
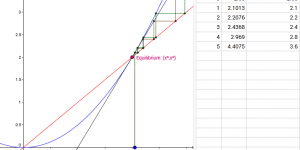
Cobwebbing, linear approximation and stability
This applet shows a linear approximation to a non-linear difference equation close to an equilibrium, using cobwebbing. It can be used to investigate the accuracy of a linear approximation, or to motivate the linear stability criterion for equilibria of a first-order difference equation.melbapplets.ms.unimelb.edu.au/2021/07/08/cobwebbing-linear-approximation-and-stability
-
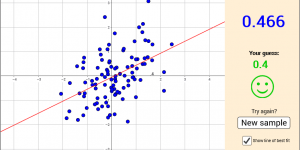
Guess the correlation
Guess the correlation of a sample of bivariate data drawn from a linear or non-linear population.melbapplets.ms.unimelb.edu.au/2021/07/08/guess-the-correlation
Number of posts found: 57